

Spend analysis is the systematic process of collecting, categorizing, and evaluating procurement data to understand an organization's spending patterns, identify savings opportunities, and make better purchasing decisions. It's the starting point for every procurement improvement initiative — from category management to supplier rationalization to compliance enforcement.
This guide covers everything procurement professionals need to know about spend analysis: why it matters, how the process works, common challenges, and how AI is changing the game in 2026.
Three key takeaways:
- The goal: Transform raw spend data into strategic intelligence that enables data-driven procurement decisions
- The process: Four repeatable steps that turn disconnected spending information into consolidated, categorized insights
- The benefits: Typical organizations achieve 5-15% cost reductions while improving supplier performance and risk management
What is spend analysis?
Spend analysis is the process of reviewing enterprise spend data to identify where costs can be reduced, efficiency can be improved, and procurement strategies can be optimized.
The spend analysis process gives you visibility into business spending and a clear way to influence financial performance. You collect spending data from various sources, cleanse it to remove errors, categorize it into a clear taxonomy, and analyze it to gain useful insights.
The goal is to make smarter sourcing decisions, improve operational efficiency, and create category management plans that deliver real results.
Types of spend analysis
Different types of spend analysis serve different strategic purposes. Most procurement teams use multiple types depending on their specific goals and priorities.
The Five Steps of Spend Analysis
Step 1: Data Extraction
Procurement data lives in multiple systems — ERPs (SAP, Oracle, Microsoft Dynamics), accounts payable systems, purchase card programs, contract management tools, and sometimes spreadsheets. The first step is extracting transaction data from all relevant sources.
Common challenges: Multiple ERPs across business units or geographies, inconsistent data formats, incomplete records, and data locked in legacy systems.
AI approach: Modern platforms like Suplari connect to data sources via APIs and automated connectors, eliminating manual export/import cycles. Suplari's AI data platform handles procurement data integration across disparate systems automatically.
Step 2: Data Cleansing and Normalization
Raw procurement data is messy. The same supplier appears under multiple names (IBM, IBM Corp, International Business Machines, IBM Global Services). Currencies differ across regions. Transaction descriptions are inconsistent. Duplicate entries exist.
Data cleansing normalizes this chaos: standardizing supplier names, converting currencies, deduplicating records, and filling gaps where possible.
Common challenges: This step consumes 60–70% of total spend analysis effort in traditional approaches. Analyst teams spend weeks or months cleansing data before any analysis can begin.
AI approach: Suplari's AI-native data platform normalizes supplier names, standardizes classifications, and cleanses data automatically. What used to take months happens during the initial data integration — no manual intervention required.
Step 3: Spend Classification
Spend classification assigns each transaction to a category taxonomy — typically UNSPSC, a custom category tree, or a hybrid framework. This is what makes analysis meaningful: instead of looking at millions of raw transactions, you can analyze spend by category, sub-category, and item.
Common challenges: Manual classification achieves 70–80% accuracy and requires constant maintenance. New suppliers, new categories, and organizational changes require ongoing reclassification. Most organizations classify spend once and let accuracy degrade over time.
AI approach: Suplari is an AI-native spend analysis platform with 95%+ classification accuracy. ML-based classification learns from your specific procurement patterns, handles new suppliers and categories automatically, and runs continuously — not as a one-time exercise. Classification accuracy improves over time rather than degrading.
Step 4: Analysis and Insight Generation
With clean, classified data, the analysis phase identifies patterns, trends, and opportunities: which categories are growing fastest, where contract compliance is weak, which suppliers represent concentration risk, and where consolidation could reduce costs.
Traditional approach: Analysts build reports and dashboards manually, exploring data to find insights. This is effective but limited by analyst capacity — a team can only investigate so many categories in a given period.
AI approach: Suplari ships with 175+ prebuilt insights that fire automatically when relevant patterns are detected in your data. You don't need to know what questions to ask — the system finds opportunities proactively. These insights cover savings identification, contract compliance, supplier risk, and category optimization.
Step 5: Action and Monitoring
The final step — and the one most often neglected — is translating insights into procurement actions and monitoring whether those actions deliver results.
Traditional approach: Insights are presented in quarterly business reviews. Action plans are created manually. Savings are tracked in spreadsheets with questionable accuracy.
AI approach: Suplari's autonomous AI agents connect insights to actions. When a savings opportunity is identified, the system tracks it through execution and verifies realization in actual transaction data. Procurement performance management becomes continuous and auditable, not periodic and approximated.
The Importance of Data Governance in Spend Analysis
Even the most sophisticated spend analysis tools deliver poor results when built on unreliable data. Data governance determines whether your spend insights drive strategic value or create confusion.
The challenge of fragmented spend data
Enterprise spend data lives across disconnected systems—ERP platforms, procurement applications, credit card processors, travel and expense tools, and accounts payable databases. Each system uses different formats, naming conventions, and data structures.
This fragmentation creates blind spots. You can’t see total spending with a supplier when they appear as “IBM,” “International Business Machines,” and “I.B.M.” across different systems. You can’t benchmark category performance when business units classify identical purchases differently.
Without unified spend data, your analysis is incomplete. You miss savings opportunities, underestimate supplier concentration risks, and make decisions based on partial visibility.
Unifying spend across enterprise systems
Effective data governance starts with connecting all major spend sources into a single, consolidated view. This means extracting data from every system where spending occurs and normalizing it into consistent formats.
The goal is comprehensive coverage that captures 90%+ of total organizational spend. Anything less leaves significant value on the table. You need purchase order data, invoice records, payment information, and general ledger transactions all working together.
Modern spend analysis platforms automate much of this consolidation. They connect to multiple data sources simultaneously, handle different formats and currencies, and update regularly to keep insights current.
Classification through appropriate taxonomy
Raw spend data means little without proper classification. A consistent spend taxonomy organizes spending into meaningful categories that support analysis and decision-making.
You can adopt industry-standard frameworks like UNSPSC (United Nations Standard Products and Services Code) or create custom taxonomies aligned with your business structure. The critical requirement is consistency—the same item must be classified the same way regardless of which business unit purchased it or which supplier provided it.
Classification enables comparison across business units, identification of category management opportunities, proper resource allocation, and meaningful benchmarking against industry standards. Without it, you’re comparing apples to oranges.
Many organizations start with high-level categories covering 80% of spend, then refine classifications over time. This iterative approach delivers value faster than waiting for perfect categorization from day one.
Enrichment with third-party data sources
Standard spend data tells you what you bought, from whom, and for how much. But strategic procurement requires additional context that doesn’t exist in your transactional systems.
Data enrichment adds critical information:
- ESG and sustainability metrics show the environmental impact of your supply chain, track carbon emissions by supplier and category, and identify opportunities to shift spending toward sustainable alternatives.
- Supplier diversity data reveals spend with minority-owned, women-owned, veteran-owned, and other diverse suppliers. This information supports diversity initiatives and helps you meet corporate commitments and regulatory requirements.
- Financial health indicators flag suppliers showing signs of distress before they impact your operations. Early warning helps you diversify sourcing or support critical suppliers proactively.
- Risk intelligence combines geographic, political, cybersecurity, and operational risk factors. You understand which suppliers create concentration risks and where your supply chain is most vulnerable.
Leading spend analysis platforms incorporate these enrichment sources automatically. The additional context transforms basic spend reporting into strategic procurement intelligence that influences sourcing decisions, risk management, and corporate responsibility programs.
Maintaining data quality over time
Data governance isn’t a one-time project. It requires ongoing attention to maintain accuracy and relevance as your business evolves.
Establish clear data ownership with assigned stewards responsible for specific domains. Run regular audits to catch quality issues before they accumulate. Create feedback loops so users can report problems and see them corrected quickly.
The investment in strong data governance pays dividends. When stakeholders trust your spend data, they act on your insights. When data quality is questionable, even the best analysis gets ignored.
Spend analysis methods and frameworks
Spend analysis uses different analytical approaches depending on your questions and maturity level. Each method builds on the previous one to create deeper insights.
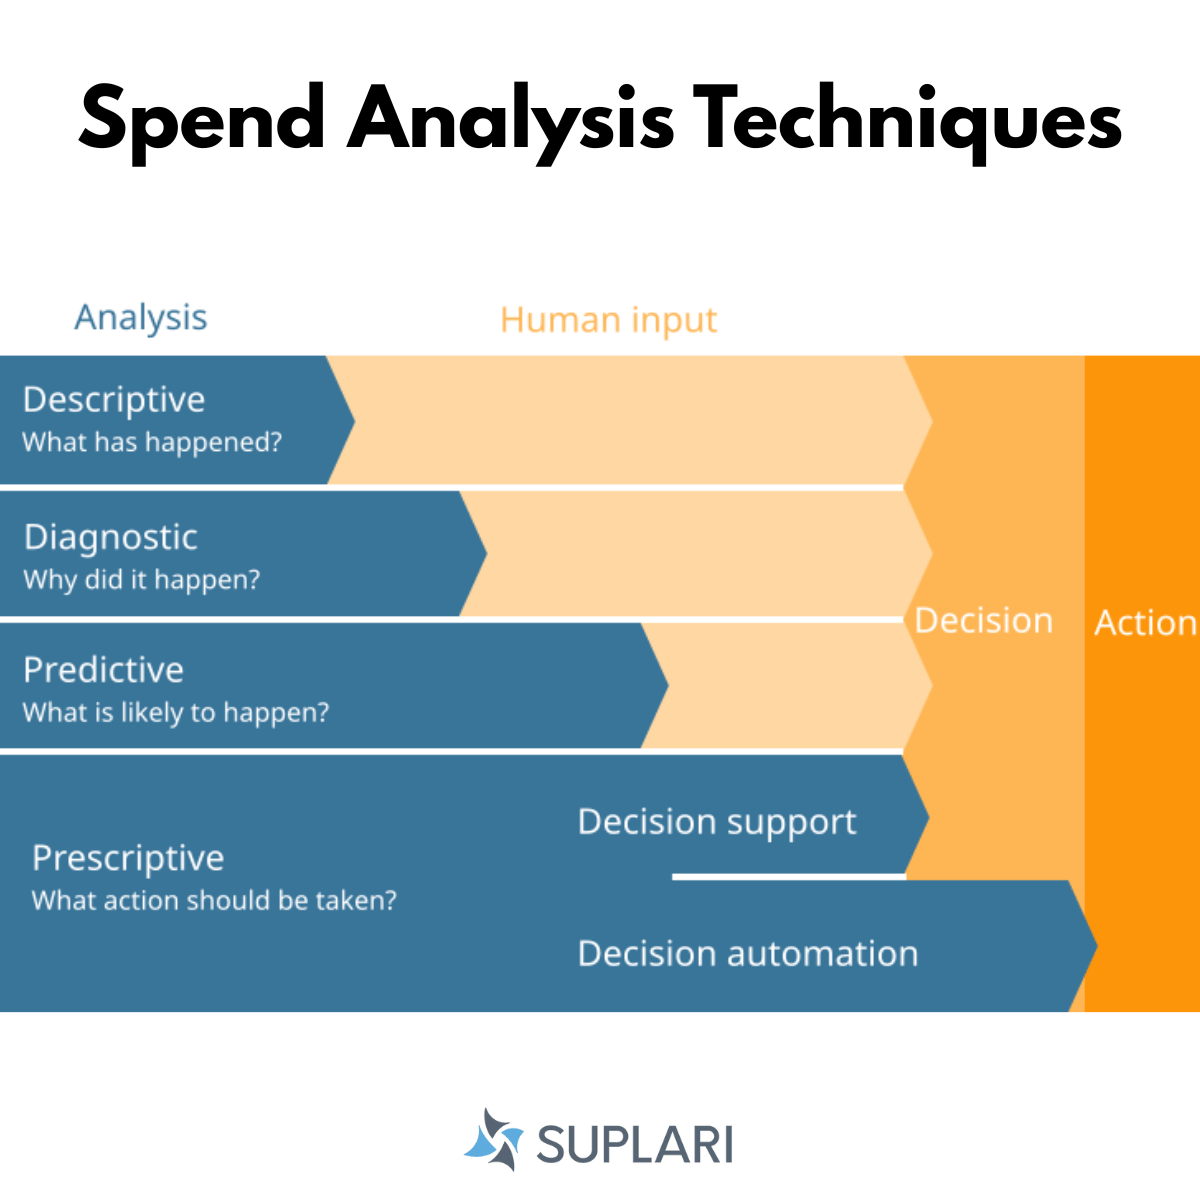
Descriptive analysis
Descriptive methods answer “What happened?” They organize past buying data to show patterns and trends.
Spend aggregation adds up all spending across business units, categories, and suppliers. This gives you baseline visibility and helps stakeholders understand the overall spending landscape.
Trend analysis tracks spending patterns over time. You find seasonal patterns, growth rates, and unusual spikes that warrant investigation.
Pareto analysis applies the 80/20 rule to find the few suppliers and categories that drive most of your spend. This helps you prioritize where to focus category management resources for maximum impact.
Variance analysis compares actual spending to budgets and forecasts. You spot gaps that need investigation and adjust plans based on reality.
These methods give you essential visibility but only look backward. You need deeper analysis to create strategic value.
Diagnostic analysis
Diagnostic methods dig deeper to answer “Why did it happen?” They find root causes of spending patterns.
Spend driver analysis breaks down spending into price, volume, and mix components. This isolates key variables so you can understand what’s really driving changes in spending levels.
Comparative benchmarking compares your performance to industry standards, peer companies, or internal targets. You identify areas where you’re paying above market rates or where processes lag best practices.
Price variance breakdown finds factors that drive price differences across business units, time periods, or suppliers. This reveals negotiation opportunities and standardization needs.
Compliance gap analysis identifies causes of maverick spending and contract leakage. You understand why people buy off-contract and what barriers prevent compliance.
These methods turn raw data into useful insights that explain what drives your procurement performance.
Predictive analysis
Predictive techniques answer “What will happen?” They use past patterns to forecast future spending needs and market conditions.
Spend forecasting projects future spending based on past trends, business plans, and market signals. This improves budget accuracy and helps you anticipate resource needs.
Price trend modeling predicts commodity and service cost changes. This helps you time sourcing decisions to capture favorable market conditions and avoid price spikes.
Demand pattern recognition spots cyclical buying needs. You optimize inventory levels and contract timing to match actual consumption patterns.
Supplier risk prediction anticipates potential disruptions based on performance data and external factors. You take preventive action before problems impact business operations.
Companies using predictive methods have an advantage. They act proactively instead of reactively.
Prescriptive analysis
Prescriptive analysis is the most advanced approach. It answers “What should we do?” and recommends specific actions based on data patterns.
Savings opportunity identification automatically highlights consolidation opportunities, negotiation priorities, and specification improvements. The system surfaces actionable recommendations rather than requiring manual analysis.
Scenario modeling tests different sourcing strategies before you implement them. You evaluate trade-offs between cost, risk, and service levels to make informed decisions.
Supplier optimization insights find ideal supplier portfolios that balance cost, risk, and performance. You understand how changes in supplier mix affect overall value.
Contract term optimization recommends ideal payment terms, volume commitments, and service levels based on actual spend patterns and market benchmarks.
Most procurement teams need a mix of all four methods. Your analytical sophistication should match your procurement maturity and available resources.
Spend cube framework
A spend cube visualizes spend data as a multidimensional cube with three primary dimensions: suppliers, categories, and business units.
This framework lets you slice and dice spending data from multiple perspectives. You might analyze IT spending across all business units, examine all purchases from a specific supplier, or review how a particular business unit spends across categories.
The spend cube makes it easy to identify patterns and anomalies. When you see that one business unit pays significantly more than others for the same category, you know where to investigate.
ABC analysis
ABC analysis categorizes items or suppliers based on their importance to your organization. This helps you prioritize resources and apply appropriate management strategies.
A items represent high-value items that require close attention and strategic management. These typically account for 70-80% of spend but only 10-20% of transactions.
B items have moderate value and receive standard procurement processes. They represent roughly 15-25% of spend and 30% of transactions.
C items are low-value items that benefit from simplified processes like purchasing cards or automated ordering. They account for only 5-10% of spend but can represent 50-60% of transactions.
ABC analysis helps you avoid spending equal effort on all items. You focus strategic resources where they’ll create the most value and streamline processes for low-value items.
Spend analysis metrics and KPIs
Peter Drucker’s adage “what gets measured gets managed” perfectly captures the essence of effective spend analytics in procurement. For procurement teams, the best starting point for any metrics is to ask what are the key measurable goals of the business.
Popular KPIs in spend dashboards
The right procurement KPIs transform data into strategic action, driving long-term value beyond simple cost savings. Here are some examples:
Organizing metrics effectively
Group related KPIs together in your dashboards:
- Strategic metrics for executives focused on total value and transformation Operational metrics for procurement teams managing daily activities
- Tactical metrics for buyers and category managers executing specific initiatives Compliance metrics for risk management and audit purposes
The best approach combines these metrics in one spend analytics solution. When you connect data that was previously separated, you see the full picture of procurement performance.
When you connect data that was previously separated, you see the full picture of procurement performance. This helps you control costs now and create strategic value for the future. It also makes your business more resilient.
Key spend analytics dashboards and visualizations
Effective dashboards transform complex spending data into clear visual insights that drive action. Different stakeholders need different views depending on their roles and responsibilities.
Spend performance dashboard
This executive-level view tracks total spend against budgets and savings targets. It shows historical trends based on key goals and provides a procurement command center that displays organizational performance at a glance.
This dashboard typically includes:
- Year-over-year spending comparisons
- Spend by business unit and category
- Key procurement metrics like contract coverage, payment periods, and purchase order compliance
- Savings achievement against targets
- Compliance rates and maverick spend alerts
Executives use this dashboard to understand procurement’s strategic contribution and identify areas needing attention.
Category performance dashboard
Category dashboards focus on specific spending areas like IT, marketing, or facilities. They show spend concentration, price trends, contract utilization, and market benchmarks.
Include supplier fragmentation metrics and savings opportunities to help category managers prioritize consolidation efforts and negotiate better deals.
Effective visualizations for category dashboards include:
- Supplier concentration charts showing top suppliers and tail spend
- Price trend lines over time
- Contract vs. non-contract spend comparison
- Benchmark comparisons against industry standards
These focused views enable data-driven category strategies aligned with market conditions and business needs.
Supplier performance dashboard
Supplier dashboards combine spend data with performance metrics across quality, delivery, risk, and innovation. They create comprehensive supplier scorecards.
Include concentration analysis to understand dependency risks and payment terms optimization opportunities. Add relationship health indicators to support strategic supplier development.
These multi-dimensional evaluations support strategic supplier management beyond simple cost considerations. You see total value including quality, innovation, and reliability factors.
Cost center dashboards
Design these dashboards for budget holders and department heads. They show departmental spend patterns, compliance with procurement policies, and savings contributions.
Include metrics on approval workflows, maverick spend alerts, and budget tracking. This drives accountability and collaboration between procurement and business units.
These dashboards transform procurement from enforcer to trusted advisor. Business units gain transparency while procurement provides guidance.
Contract compliance dashboard
Contract compliance dashboards track spend against negotiated agreements. They monitor off-contract purchasing, approaching renewal dates, and contract utilization rates.
Include price variance alerts, volume commitment tracking, and rebate qualification status. These proactive views prevent value leakage and strengthen contract governance.
You identify opportunities for better terms in future negotiations based on actual usage patterns versus original assumptions.
Effective visualization types
Different visualization formats reveal different insights:
Bar charts compare spending across categories, suppliers, or time periods. They make relative sizes immediately apparent.
Pie charts show spending composition and help identify concentration. Use them sparingly for high-level overviews.
Line charts display trends over time. They reveal seasonality, growth patterns, and the impact of initiatives.
Heat maps highlight problem areas or opportunities across multiple dimensions. Color coding makes patterns instantly visible.
Sankey diagrams show spending flows from business units through categories to suppliers. They reveal the complete spending journey.
Scatter plots compare two variables like price versus volume to identify outliers and correlation patterns.
The best dashboards combine multiple visualization types to tell a complete story. They answer the questions stakeholders actually have rather than just displaying available data.
Benefits of spend analysis
Spend analysis delivers value through cost reduction, risk mitigation, improved sourcing, streamlined processes, and stronger supplier relationships. Organizations typically achieve 5-15% cost reductions within the first year.
Cost reduction
The most immediate benefit is finding hidden cost savings in your data. Spend analysis shows you where you pay too much, when you buy the same items from different suppliers, and where you miss volume discount opportunities.
You gain a blueprint for cost reductions. You can combine scattered purchases with your best suppliers, negotiate based on facts about actual volumes and pricing, and identify which suppliers charge more than they should.
Common savings opportunities include:
- Supplier consolidation that increases volume leverage
- Price harmonization across business units
- Contract compliance that captures negotiated terms
- Specification standardization that reduces complexity
- Demand management that eliminates unnecessary purchases
Risk management
Your spending data reveals where your supply chain is most vulnerable. Spend analysis identifies supplier risks before they materialize—over-concentration with single suppliers, geographic concentration, or financial instability warning signs.
It catches contract leakage when you pay more than agreed rates or when invoices don’t match purchase orders. This visibility keeps corporate buying within policy guidelines and legal requirements.
Risk insights include:
- Supplier dependency that threatens business continuity
- Compliance violations that create legal exposure
- Quality issues before they escalate to major problems
- Financial health warnings from payment pattern changes
- Geographic or political risks in your supply base
Strategic sourcing
Instead of guessing, spend analysis provides data for sourcing decisions. You see which suppliers offer the best total value—not just the lowest price.
This knowledge guides your strategic sourcing plans and helps you select suppliers and negotiate contracts. You find categories ready for purchase consolidation or increased competition. You can also time your market moves when you have the most leverage.
Strategic advantages include:
- Fact-based supplier selection versus relationship-based choices
- Negotiation leverage from understanding total volumes
- Market timing based on commodity trends and demand patterns
- Category strategies built on actual spending analysis
- Total cost of ownership calculations that include quality and service
Process optimization
Spend analysis reveals where your buying processes fail. You spot bottlenecks that hurt cycle times, find manual tasks that could be automated, and identify redundant steps that add no value.
This knowledge lets you redesign workflows so your team spends less time on paperwork and more time on strategic work that matters.
Process improvements include:
- Automated purchase order creation for routine items
- Streamlined approval workflows based on risk and value
- Self-service procurement for low-value items
- Electronic invoicing that reduces processing time
- Contract templates that accelerate negotiations
Supplier performance management
When you know your real spending patterns, you manage supplier performance more fairly and effectively. The data supports productive discussions about pricing, quality, and innovation.
You move from simple transactional relationships to strategic partnerships. Both sides benefit from collaborative problem-solving and innovation.
Better supplier relationships deliver:
- Joint cost reduction initiatives that benefit both parties
- Innovation partnerships that create competitive advantages
- Quality improvements through data-driven discussions
- Service level agreements based on actual performance data
- Long-term contracts that provide mutual stability
Common challenges to spend analysis
According to the Hackett Group, 34% of procurement executives say their current spend analysis solution falls short.
The most common challenges include:
How to overcome common challenges
Establish strong data governance from the start. Set clear data standards and ownership responsibilities to ensure consistent, high-quality data collection across all procurement touchpoints.
Run regular data audits and quality checks to maintain integrity over time. Assign data stewards who are accountable for specific data domains.
Don’t obsess over perfect categorization initially. Spend categorization improves iteratively over time. A clear and consistent taxonomy aligned with business needs beats pursuing 100% perfection from day one.
Start with major categories that cover 80% of spend, then refine over time. Accept that some items will be difficult to categorize and focus on the high-value areas first.
Focus on actionable insights over comprehensive data collection. Prioritize analyses that directly support business decisions and cost reduction. Don’t pursue complete visibility just for its own sake.
Executive stakeholders need clear connections between analysis findings and business impact. Show them how the data enables better decisions and measurable results.
Enable continuous improvement through regular review cycles. Update classifications quarterly, refresh data monthly, and incorporate new spending categories as business needs evolve.
Quarterly reviews typically provide the right balance between keeping data current and avoiding excessive resource demands. Monthly reviews work for fast-moving categories or high-priority initiatives.
Automate wherever possible to reduce manual effort and improve accuracy. Modern spend analysis software can automate data collection, cleansing, categorization, and routine reporting.
This frees your team to focus on analysis and strategy rather than data preparation. Automation also improves consistency and eliminates human error.
Start with executive sponsorship to ensure resources and adoption. Without leadership support, you’ll struggle to get data access, secure budget, and drive organizational change.
Clear executive backing also helps overcome resistance from business units that may be reluctant to share spending data or change existing processes.
Integrate with existing systems rather than creating standalone solutions. Spend analysis works best when connected to your ERP, procurement platform, and financial systems.
Real-time integration provides up-to-date insights and reduces the manual effort required to keep data current.
Provide training and support to ensure adoption. Even the best spend analysis solution fails if people don’t know how to use it or understand the insights it provides.
Create role-based training that shows stakeholders how to find the information they need and act on insights relevant to their responsibilities.
Which spend analysis solution to choose?
If you’re reading this guide you may be also exploring a spend analysis solution for your own needs. Your best-fit option will depend on your needs and resources. Here are your options:
Building your own spend analysis in Excel
Before investing in dedicated software, many organizations start with Excel-based spend analysis. This DIY approach teaches you what questions matter most and helps you understand the mechanics of spend analysis.
While Excel has limitations for enterprise-scale analysis, it’s an accessible starting point that can deliver quick wins and build the business case for more sophisticated tools.
When Excel reaches its limits
Excel works well for organizations with straightforward spending patterns and limited data volumes. You’ll know it’s time to graduate to dedicated software when:
- Your spend dataset exceeds 100,000 rows and Excel performance suffers
- You need real-time or near-real-time visibility rather than periodic reports
- Manual data cleansing and categorization consumes excessive time
- Multiple stakeholders need simultaneous access to spend insights
- You require advanced analytics like predictive modeling or automated anomaly detection
- Integration with other systems becomes critical for workflow efficiency
At this point, the time spent maintaining Excel-based analysis exceeds the value of insights delivered. Purpose-built spend analysis software delivers better results with less effort.
Spend analysis consultant
A spend analysis consultant is an external expert who helps businesses review their procurement data. They identify cost-saving opportunities and improve sourcing strategies. These consultants typically perform deep-dive analyses using historical spend data to deliver actionable insights.
Many consultant-led projects result in a spend cube. This is a structured data model that categorizes procurement spend across various dimensions such as supplier, category, and department.
Pros of a spend analysis consultant:
- Quick insights without a long-term commitment
- Expertise from industry or procurement specialists
- Minimal internal resource requirements
Cons of a spend analysis consultant:
- Static results that quickly become outdated
- Limited ability to track savings over time
- High cost for a single-use analysis
When is a consultant the right choice?
A consultant-led approach is best suited for smaller businesses with limited procurement complexity. If your company does not have a dedicated procurement team or needs a one-time evaluation of spend patterns, hiring a consultant may be the most effective way to gain insight into savings opportunities.
If your business has recurring procurement needs, or if you want to track ongoing improvements over time, a more continuous solution may be a better fit. This could be either through an outsourced service or spend analysis software.
Spend analysis services
For some organizations, a one-time analysis isn’t enough. A software solution may not be feasible either. Whether due to strict regulatory requirements or IT restrictions, businesses in these situations require a structured, ongoing approach to procurement analytics.
What is an outsourced spend analysis service?
An outsourced spend analysis service involves hiring an external provider to regularly review and interpret your procurement data. Instead of conducting a one-time deep dive, these services offer ongoing insights. They’re often delivered quarterly or monthly using pivot tables and customized reporting.
These services are particularly valuable for businesses that require regular spend monitoring but lack the internal expertise or resources to manage it in-house.
Pros of spend analysis services:
- Niche industry expertise tailored to regulatory requirements
- Bespoke analysis designed to apply to uncommon procurement use cases
- Easier compliance tracking
- Avoids the need for external procurement software in restricted IT environments
Cons of spend analysis services:
- Dependent on external consultants, reducing control
- Slower access to insights compared to real-time solutions
- Costs accumulate over time, often exceeding software solutions
When is an outsourced service the right choice?
Businesses operating in regulated industries like banking and healthcare benefit the most from an ongoing spend analysis service. Those with IT policies that prohibit external procurement software also benefit. These companies often require specialized expertise to track compliance, supplier risk, and cost optimization opportunities while adhering to strict internal and external policies.
If your organization relies on detailed, industry-specific spend insights and needs expert guidance, an outsourced service can be an effective solution. However, for enterprises seeking real-time analytics and proactive insights, an automated spend analysis software may be the better long-term investment.
Spend analysis software
For organizations with extensive procurement operations, an AI-powered spend analytics platform like Suplari provides real-time insights, automated anomaly detection, and predictive spend optimization.
By leveraging AI in spend harmonization, organizations gain instant transparency into their spend data. They uncover risks and savings opportunities and improve compliance tracking—all without the delays and inefficiencies of traditional approaches.
Pros of spend analysis software:
- Always-on spend analytics with real-time visibility
- Automated categorization and normalization, eliminating manual effort
- AI-powered insights to highlight savings opportunities and mitigate risks
- Scalable to handle enterprise-wide data across multiple business units
- Constantly improving by collecting feedback and best practices from a broad set of customers
Cons of spend analysis software:
- Requires an initial setup and integration with existing procurement data sources
- May not address very niche industries and use cases out of the box
Key features of modern spend analysis software
Modern spend analytics software offers a range of powerful features that help businesses optimize procurement, reduce inefficiencies, and drive cost savings. Below are some of the key functionalities that set these tools apart.
Real-time analytics
Modern spend analysis solutions provide real-time analytics. This allows procurement teams to monitor spending patterns as they occur. Instead of waiting for quarterly or annual reports, businesses can react instantly to cost fluctuations, supplier changes, and market conditions. This level of visibility ensures that cost-saving opportunities and potential risks are identified early, leading to more proactive and informed decision-making.
Automated categorization
One of the biggest challenges in spend analysis is organizing and categorizing procurement data efficiently. With automated spend categorization, businesses no longer need to manually sift through invoices, spreadsheets, and purchase records. The software automatically classifies and normalizes data, making it easier to track trends, compare supplier performance, and enforce procurement policies without time-consuming manual intervention.
AI-powered insights
AI-driven spend analysis software goes beyond basic reporting by proactively identifying spending anomalies, cost-saving opportunities, and supplier risks. These AI-generated insights help businesses make data-backed decisions that optimize procurement efficiency. Whether it’s uncovering redundant supplier contracts, detecting fraud risks, or highlighting pricing inconsistencies, AI-powered insights drive smarter procurement strategies and cost control.
Collaboration tools
Effective procurement management requires seamless collaboration between finance, procurement, and operations teams. Modern spend analysis platforms include collaboration tools that enable users to assign tasks, track procurement initiatives, and measure the impact of cost-saving strategies. With centralized dashboards and goal tracking, businesses can ensure accountability and alignment across departments, leading to more strategic and measurable procurement outcomes.
When is automated software the right choice?
For enterprises that require scalability, efficiency, and proactive spend management, AI-powered spend analysis software is the best investment. Unlike one-off consulting projects or slow, manual services, software solutions provide real-time access to procurement data, enabling faster decision-making and greater cost control.
By integrating AI-driven insights, businesses can optimize procurement strategy, improve supplier negotiations, and ensure compliance—all while reducing operational overhead. For companies looking to enhance procurement visibility and drive meaningful impact, automated spend analysis software offers the most comprehensive and effective solution.
Spend analysis case studies
The true value of spend analysis becomes clear through real-world use. These recent spend analysis case studies show how advanced spend analysis transforms concepts into tangible business results.
Nordstrom
Challenge: Fragmented data prevented comprehensive spend visibility across Nordstrom’s complex retail operations.
Solution: Suplari consolidated spend data. This enabled the team to “slice and dice in various ways” and reveal previously hidden insights.
Outcome: Procurement elevated from a tactical function to a strategic partner. They built trust through “factual, repeatable, succinct, and meaningful information.”
“Suplari gave us the tools to truly understand our spend,” Karoline explains. “We could see who the suppliers are, what we’re spending with them, and who within the company is engaging with them. This visibility allowed us to craft strategies for improvements and unlock value within a long-standing organization.”
The platform’s consistent, reliable data became the foundation for more strategic supplier relationships. It also improved cross-functional collaboration and drove measurable procurement improvements throughout the enterprise.
BT Sourced
For Diarmuid O’Donoghue, Head of Digital Procurement at BT Sourced (British Telecom’s procurement branch), the goal wasn’t just gathering data. He wanted to transform it into actionable insights that drive meaningful change.
Challenge: Disparate systems and manual processes left category managers dependent on Excel. They had limited visibility into strategic opportunities.
Solution: Suplari’s intuitive platform provided actionable insights accessible in “essentially two clicks.” This enabled quick identification of high-growth suppliers and compliance issues.
Outcome: Transformed procurement from reporting function to strategic advisor through data-driven decision-making.
“We didn’t want just a general spend platform that relayed spend information back to us,” Diarmuid notes. “We wanted something different that would help us unlock the true value of procurement away from general cost savings.”
By making the platform accessible across finance, sales, and accounting, BT Sourced freed its procurement team to focus on strategic initiatives. They also empowered stakeholders with self-service analytics. This approach transformed how the entire organization views procurement’s contribution.
MediaNews Group
Jeff Ball, Head of Procurement at MediaNews Group (one of the nation’s largest newspaper publishers), found in Suplari the perfect tool to support the company’s zero-based budgeting approach.
Challenge: Complex organizational structure with properties like Chicago Tribune and New York Daily News required granular spend visibility for effective cost management.
Solution: Suplari’s intuitive analytics provided comprehensive spend baseline with easy-to-use visualizations and sourcing opportunity identification.
Outcome: Enabled data-driven budget discussions and revealed significant price discrepancies across business units.
“All of this comes from having the data at your disposal, at your fingertips,” Jeff explains. “You can say, ‘Why is this cluster of titles or business units paying 5X, 10X more for the same product and service that these clusters of titles are paying for?’ You can’t do that without Suplari.”
The platform’s ability to identify spending trends, facilitate cross-departmental collaboration, and support decision-making proved invaluable for zero-based budgeting initiatives. It transformed procurement from a back-office function into a strategic driver of cost savings.
Future of spend analysis
Procurement needs to evolve from a tactical function into a strategic business partner. The ability to transform raw spend data into actionable intelligence has become a critical competitive advantage. Modern spend analysis goes beyond simple reporting to deliver insights that drive measurable business impact.
Intelligence-driven procurement
The shift from spreadsheets to AI-powered spend analytics is more than just new technology. It shows how organizations now view procurement’s strategic value.
Today’s most successful procurement teams can quickly analyze complex spend patterns. They find hidden opportunities and act fast based on data insights.
This change is clear in our case studies. Companies like Nordstrom, BT Sourced, and MediaNews Group used advanced spend analysis to transform procurement. They went from cost centers to strategic value creators. Their success stories share one thing: they made spend data accessible, actionable, and aligned with business goals.
AI-Powered Spend Analysis with Suplari
Suplari is the leading AI procurement intelligence platform for spend analysis, combining AI-ready spend data management with 175+ prebuilt insights and autonomous agents. Here's why organizations are choosing AI-powered spend analysis over traditional approaches:
No data preparation required. Suplari's AI data platform handles integration, cleansing, normalization, and classification automatically. You don't need to solve the data problem before deploying.
Continuous intelligence, not periodic reports. Prebuilt insights and AI agents monitor your spend data 24/7, surfacing opportunities and risks as they emerge — not at the next quarterly review.
95%+ classification accuracy. ML-based spend classification that learns from your data and improves over time, running continuously rather than as a one-time exercise.
90-day deployment. Suplari replaces manual spend analysis with continuous AI-powered intelligence in a quarter, not a year. The automated data platform eliminates the months-long data preparation phase that delays traditional spend analysis tools.
Connected to action. Insights connect to specific recommendations. Savings are tracked from identification through realization. Performance is measured continuously.
For a comparison of spend analysis tools, see our guide to the best spend analytics software. For a broader look at AI in procurement, see our best AI procurement software comparison.
Make the right choice for your business
Your choice for spend analytics solution depends on your needs:
- Small businesses may benefit from a one-time consultant
- Regulated companies may prefer an ongoing service
- Enterprises wanting scale, speed, and automation will gain most from AI-driven spend analysis software like Suplari
Suplari is the highest-rated spend analysis software on Gartner Peer Insights and the Spend Matters Solution Map. Leading enterprises trust us to deliver smart procurement insights. Our solution goes beyond reports. It finds savings opportunities and risk strategies in real time.Want to see how Suplari can transform your spend analysis? Request a demo today!
Spend analysis glossary
Understanding the terminology is essential for effective spend analysis. This glossary defines the core concepts procurement professionals need to know.

