

Do you feel the constant need to deliver more value, reduce costs, and mitigate risks? If so, it may be time to review your options for spend cube analysis.
This comprehensive guide is designed to help you understand what spend analysis is, why it matters, and how to select the best-fit approach for your organization.
This spend cube analysis guide is primarily intended for:
- Chief Procurement Officers and procurement leadership
- Category managers seeking to improve their analytical capabilities
- IT professionals supporting procurement functions
- Finance leaders looking to improve spend visibility and control
- Business analysts working on procurement transformation projects
Whether you're considering investing in spend analytics software or looking to upgrade an existing approach, this guide will provide you with a clear understanding of your options, their benefits, limitations, and how to make an informed decision that aligns with your strategic objectives.
What is spend cube analysis?
Spend analysis is the systematic process of collecting, cleansing, classifying, and analyzing expenditure data to reduce costs, improve operational efficiency, and enhance supplier relationships. It transforms raw transaction data into actionable insights that drive strategic procurement decisions.
At its core, spend analysis answers critical questions such as:
- How much are we spending?
- What are we buying?
- From whom are we purchasing?
- At what prices and on what terms?
- Are we complying with negotiated contracts?
- Where are the opportunities for consolidation and savings?
The answers to these questions form the foundation of effective procurement strategy, enabling data-driven decisions rather than intuition-based approaches and tactical buying.
The evolution of spend cube solutions
Spend analysis has come a long way from manual spreadsheet analysis and periodic spend cube reviews. You can imagine the solutions emerging in three main waves.
- First wave (1990s-2000s): Basic spend reporting using spreadsheets and simple database queries, typically conducted quarterly or annually as one-off exercises
- Second wave (2000s-2020s): Dedicated spend analysis tools with improved classification capabilities and visualization, enabling more regular analysis
- Third wave (2020s-present): Cloud-based, AI-powered solutions offering continuous analysis, predictive insights, and automated opportunity identification

Suplari was the first AI-native spend cube analysis solution introduced in 2017.
AI-powered spend cube analysis using agentic AI
Traditional spend cubes require constant refreshing to maintain accuracy. This process that creates gaps where critical insights go unnoticed. Suplari eliminates this fundamental limitation through its AI Agent architecture that operates continuously across your spend data.
The Suplari Agent analyzes your procurement data in real-time, combining internal transaction patterns with live external market intelligence. Instead of waiting for monthly or quarterly cube refreshes, you receive immediate alerts when supplier prices drift from market rates, when consolidation opportunities emerge, or when compliance risks appear. This continuous monitoring transforms spend analysis from a periodic exercise into an always-on strategic advisor.
What sets Suplari apart is how the Agent integrates diverse data sources. Your ERP systems, contract repositories, supplier performance metrics, and external market data can all be analyzed in real time without requiring manual cube rebuilds. Category managers can ask natural language questions and receive instant insights that would traditionally require days of analysis and cube manipulation.
The result is procurement intelligence that keeps pace with your business. While competitors remain locked in refresh cycles, Suplari delivers actionable recommendations the moment opportunities arise, enabling faster decision-making and greater savings capture across your addressable spend.
Importance of automated spend analytics in procurement
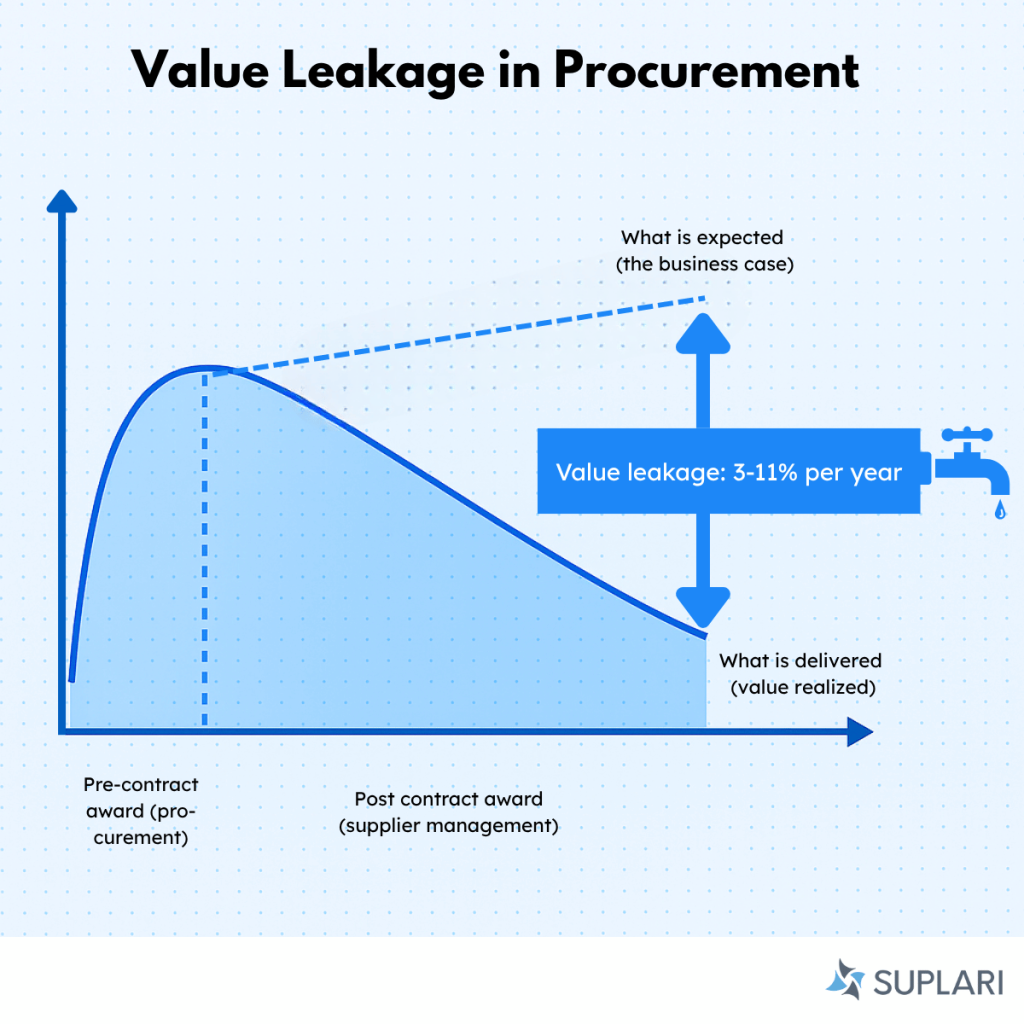
Procurement organizations without effective spend analysis face an uphill struggle to deliver and prove impact on the financial bottom line.
Fragmented spend data can blind procurement teams to wasteful purchasing patterns, allowing maverick spending to proliferate unchecked. This lack of visibility creates fertile ground for duplicate suppliers, inconsistent pricing, and missed volume discount opportunities.
Without data-driven insights, category managers can resort to gut-feeling decisions, leading to suboptimal supplier selection and ineffective negotiations. Companies also remain vulnerable to concentration risks, compliance violations, and poor supplier performance that goes undetected until critical failures occur.
According to Gartner, the cumulative impact of these procurement inefficiencies can cost organizations 3-11% of their addressable spend annually—a substantial financial drain that compounds year after year.
Benefits of spend cube analysis
The core benefits of spend analysis is that it gives visibility to procurement performance, enabling data-driven decisions and factual negotiations on strategic sourcing. You can see these benefits materialize in various dimensions across a procurement organization:
Spend cube analysis methods
Effective spend analysis extends beyond basic reporting to incorporate multiple analytical approaches that deliver progressively deeper insights. Each method serves different strategic purposes within your procurement transformation journey.
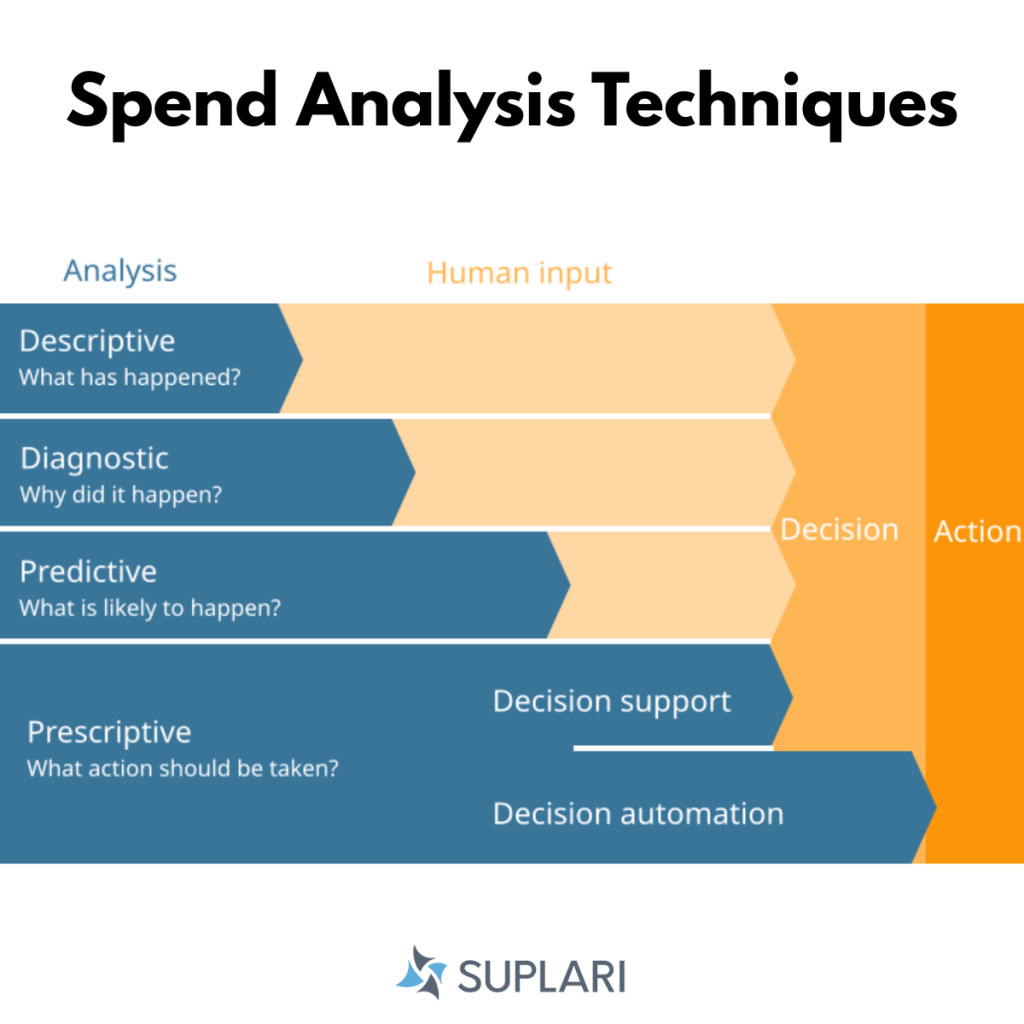
Descriptive analysis methods
Descriptive methods form the foundation of spend analysis by answering the question "What happened?" These approaches organize historical purchasing data to reveal patterns and trends:
- Spend aggregation: Consolidating total expenditure across business units, categories, and suppliers to establish baseline visibility
- Trend analysis: Tracking spend patterns over time to identify seasonality, growth rates, and anomalies
- Pareto analysis: Applying the 80/20 rule to identify the vital few suppliers and categories driving the majority of spend
- Variance analysis: Comparing actual versus budgeted spend to highlight deviations requiring investigation
While descriptive methods provide essential visibility, they remain backward-looking and require further analysis to generate strategic value.
Diagnostic analysis methods
Diagnostic approaches dig deeper to answer "Why did it happen?" by identifying root causes of spending patterns:
- Spend driver analysis: Breaking down expenditure into price, volume, and mix components to isolate key variables
- Comparative benchmarking: Assessing performance against industry standards, peer organizations, or internal targets
- Price variance decomposition: Isolating factors driving price differences across business units, time periods, or suppliers
- Compliance gap analysis: Identifying causes of maverick spending and contract leakage
These methods transform raw data into contextualized insights that explain underlying factors driving procurement performance.
Predictive analysis methods
Predictive techniques answer "What will happen?" by using historical patterns to forecast future spending:
- Spend forecasting: Projecting future expenditure based on historical trends, business plans, and market indicators
- Price trend modeling: Predicting commodity and service cost fluctuations to inform sourcing timing
- Demand pattern recognition: Identifying cyclical purchasing needs to optimize inventory and contract timing
- Supplier risk prediction: Anticipating potential disruptions based on performance indicators and external data
Organizations leveraging predictive methods gain advantage through proactive rather than reactive procurement strategies.
Prescriptive analysis methods
The most advanced approach, prescriptive analysis, answers "What should we do?" by recommending specific actions:
- Savings opportunity identification: Automatically highlighting consolidation, negotiation, and specification optimization opportunities
- Scenario modeling: Evaluating potential outcomes of different sourcing strategies before implementation
- Supplier optimization insights: Determining ideal supplier portfolios balancing cost, risk, and performance
- Contract term optimization: Recommending ideal payment terms, volume commitments, and SLAs based on spend patterns
For most procurement organizations, effective spend analysis requires a strategic blend of descriptive, diagnostic, predictive, and prescriptive methods. Your organization's analytical sophistication, data granularity, and automation capabilities should align with your procurement maturity and available resources.
Four stages of spend cube analysis
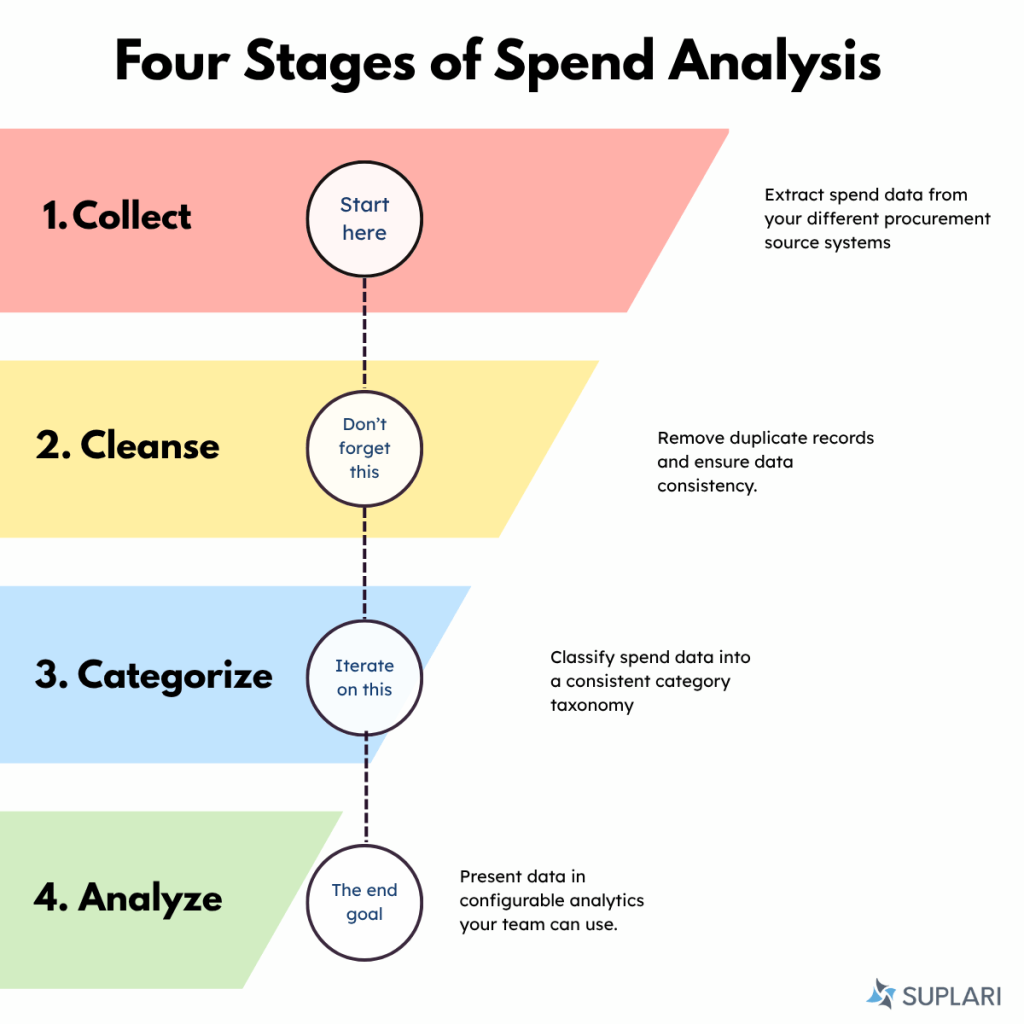
Whether you’re doing spend analysis in a spreadsheet, an SQL database, or a spend analysis tool, you’re likely to follow four key stages: collect, cleanse, categorize and analyze.
1. Collect
Extract procurement data from all your spending sources—ERP systems, P-cards, and AP files. To form a detailed analysis, capture essential elements including supplier information, transaction amounts, dates, cost centers, and contract references.
2. Cleanse
Address data quality issues affecting your procurement source data, for example, by standardizing supplier names, correcting data formatting errors, and eliminating duplicate records. If this is done manually it can be an error-prone and time-consuming task.
3. Categorize
Map your transactions to a standard taxonomy, harmonize purchase records across business units and allocate spend to pre-defined categories. Apply consistent classification rules to reveal spending patterns per dimensions such as supplier, time, location, or department.
4. Analyze
Transform your cleansed, categorized data into actionable insights that identify savings opportunities, compliance issues, and supplier risks. Implement interactive dashboards to present findings to stakeholders, enabling data-driven decisions that deliver measurable procurement improvements.
While this four step process sounds clear, most procurement organizations will face thousands of suppliers, hundreds of thousands of transactions with millions of individual data points to analyze. It’s no surprise that automated spend analysis is one of the top priorities of modern-day procurement executives.
Best practices for spend data visualization
Modern procurement teams require dynamic spend data visualization capabilities that overcome the limitations of static, cumbersome spreadsheet reports or pivot tables. Here are some best practices to consider in your spend analysis solution.
Strategic use of charts
Choose visualization types that highlight exactly where to focus your efforts. Deploy bar charts for comparisons, pie charts for composition, treemaps for hierarchical data, and heat maps for identifying patterns across multiple dimensions. Keep visualizations simple and purpose-driven—each chart should answer a specific business question rather than displaying data for its own sake.
Configurable, role-based dashboards
Implement role-based dashboards that users can customize to their specific responsibilities. Provide executives with high-level KPIs and trend indicators, give category managers detailed supplier performance metrics, and equip procurement analysts with compliance tracking visualizations. Your solution should adapt to these varying needs without requiring IT support for each modification.
Interactive drill-downs
Enable users to explore data dynamically from summary overviews to transaction-level details with a few clicks. This multi-level visibility allows procurement professionals to investigate anomalies, test hypotheses, and discover insights independently rather than waiting for predefined reports. Support both vertical drill-downs (deeper into categories) and horizontal exploration (across time periods or business units).
Pareto-focused analysis
Design visualizations that immediately highlight the vital few suppliers, categories, and transactions driving the majority of your spend impact. Apply the 80/20 rule in design choices and visual emphasis to ensure attention remains on high-value opportunities rather than being diluted across insignificant spending areas.
Prescriptive insights
Move beyond backward-looking reporting by incorporating prescriptive insights directly into your visualizations. Prescriptive elements transform passive dashboards into proactive advisory tools that guide users toward specific actions— for example, highlighting duplicate suppliers ready for consolidation, categories exceeding price benchmarks, or payment terms ripe for optimization.
Example of prescriptive analytics in procurement - Suplari AI Agent
Key spend cube analysis dashboards
Implement these five core dashboard types to provide stakeholders with comprehensive spend visibility tailored to their specific decision-making needs:
1. Spend performance dashboard
An executive-level view tracking total spend against budgets, savings targets, and historical trends based on key goals. Typically this includes year-over-year comparisons, spend by business unit, and procurement KPIs such as contract coverage, average payment period and PO compliance. This dashboard serves as your procurement command center, highlighting organizational performance at a glance while identifying areas requiring strategic intervention.
2. Category performance dashboard
Category-specific dashboards display spend concentration, price variance, contract utilization, and market benchmarks. You can include supplier fragmentation metrics and savings opportunity indicators to help category managers prioritize consolidation efforts and negotiate more effectively. These focused views enable data-driven category strategies aligned with market conditions and business requirements.
3. Supplier performance dashboard
Comprehensive supplier scorecards integrating spend data with performance metrics across quality, delivery, risk, and innovation dimensions. Include concentration analysis, payment terms optimization opportunities, and relationship health indicators. These multidimensional evaluations support strategic supplier management beyond simple cost considerations.
4. Cost center dashboards
Design budget-holder dashboards show departmental spend patterns, compliance with procurement policies, and savings contributions. You can include metrics on approval workflows, maverick spend alerts, and budget tracking to drive accountability and collaboration between procurement and business units. These dashboards transform procurement from enforcer to trusted advisor.
5. Contract compliance dashboard
Implement contract monitoring dashboards tracking spend against agreements, off-contract purchasing, and approaching renewal dates. Include price variance alerts, volume commitment tracking, and rebate qualification status. These proactive views prevent value leakage and strengthen contract governance while identifying opportunities for improved terms in future negotiations.
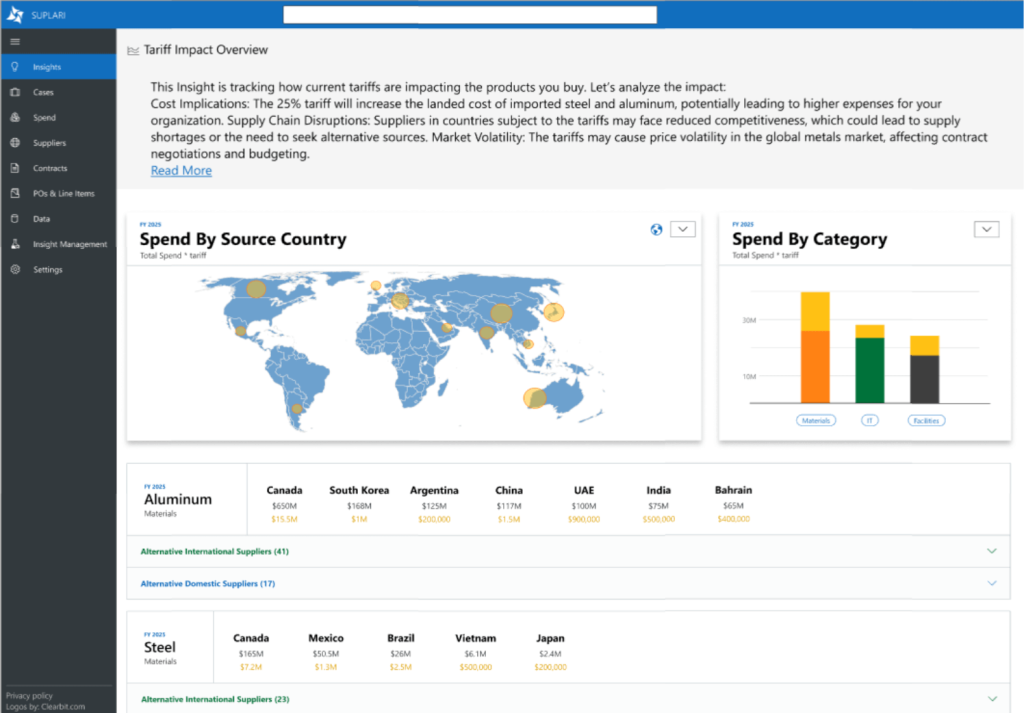
Example of a configurable spend analysis dashboard in Suplari Tariff Insights Overview.
Spend cube analysis metrics and KPIs
Peter Drucker's adage "what gets measured gets managed" perfectly captures the essence of effective spend analytics in procurement. For procurement teams, the best starting point for any metrics is to ask what are the key measurable goals of the business.
Popular KPIs in spend dashboards
The right procurement KPIs transform data into strategic action, driving long-term value beyond simple cost savings. Here are some examples:
- Total spend breakdowns by category, supplier, and business unit
- Spend under management (SUM) percentage tracking procurement's influence
- Contract-invoice-PO matching to prevent financial leakage
- Maverick spend identification to capture non-compliant purchasing
- Supplier fragmentation to identify consolidation opportunities
- On-time and in-full (OTIF) delivery performance tracking
- Supplier compliance with regulatory and certification requirements
- Cost variance over time to flag pricing inconsistencies
- New/unaccounted-for spend detection for emerging cost categories
- Preferred supplier utilization rates to ensure negotiated value capture
- Purchase price variance (PPV) tracking expected versus actual costs
- Supplier price variance across vendors for identical items
The most effective approach integrates these metrics in a centralized spend analytics solution that provides real-time visibility. By connecting historically isolated data points, you gain a holistic view of procurement performance that enables both immediate cost control and strategic value creation, while ensuring greater business resilience.
Spend analysis tools
Today you have multiple options for implementing spend analysis, each with distinct capabilities, limitations, and resource requirements. The three most commonly used approaches include spend analysis reports in spreadsheets, spend analytics in business intelligence tools and dedicated spend analytics software.
Solution TypeKey AdvantagesKey LimitationsSpreadsheets & Pivot Tables• Low implementation cost
• Familiar interface with minimal training
• Flexibility for ad-hoc analysis
• Quick implementation
• No IT dependency• Labor-intensive manual data processing
• Poor scalability beyond 1M rows
• Limited data model complexity
• Minimal data governance controls
• Difficult collaboration and version controlBI Reporting with SQL Databases• Handles larger data volumes
• Supports complex data relationships
• Scheduled refreshes and automation
• Basic visualization capabilities
• Better collaboration and governance• Requires technical SQL expertise
• Lacks procurement-specific taxonomies
• Significant implementation time
• Custom development for supplier enrichment
• Limited AI/predictive capabilitiesDedicated Spend Analysis Software• Pre-built procurement data models
• Automated data cleansing and classification
• AI-powered categorization
• Supplier data enrichment
• Purpose-built procurement dashboards
• Predictive analytics and opportunity identification
• Lower total cost of ownership• Higher initial investment
• May require process adjustments
• Needs to be aligned to your business needs.
Which option is right for you?
Whether you build or buy a spend analysis solution depends on your specific needs, data complexity, available resources, and strategic objectives.
Spreadsheets and pivot tables serve as an entry point for organizations with limited spend data, straightforward purchasing patterns, and early-stage procurement functions. While accessible, they quickly become inefficient as data volumes and analytical requirements grow.
BI reporting with SQL databases represents a mid-tier solution appropriate for organizations with technical resources and moderate data complexity. This approach works well when procurement can leverage existing enterprise BI investments but often requires significant custom development and IT resources.
Spend analysis software delivers the strongest ROI for mid-size to large organizations through automation of labor-intensive processes, procurement-specific intelligence, and strategic insights that generic tools cannot provide. The productivity gains and enhanced decision-making capabilities typically offset the higher initial investment.
Key implementation considerations
As you evaluate your organization's spend analysis approach, consider these essential factors:
- Match technology to maturity: Select solutions that align with your procurement function's current capabilities while supporting your growth trajectory. The most sophisticated technology will not deliver value without corresponding organizational readiness.
- Prioritize data quality: Invest adequately in the collection, cleansing, and classification stages, as the accuracy of your insights will never exceed the quality of your underlying data.
- Balance depth with accessibility: Ensure your approach delivers both sophisticated analytical capabilities for procurement professionals and intuitive interfaces for stakeholders across the organization.
- Connect insights to action: Design your spend analysis program with clear pathways from insight to implementation, embedding analytics directly into sourcing, supplier management, and contract compliance workflows.
- Measure and communicate value: Establish clear metrics that demonstrate how spend analysis contributes to strategic business goals, and consistently communicate these outcomes to leadership.
Advanced spend analytics examples
The true value of spend analysis becomes clear through real-world implementation. These case studies from organizations using Suplari's spend analytics platform demonstrate how advanced spend analysis transforms theoretical concepts into tangible business outcomes.
Nordstrom
When Karoline Dygas, Global Supply Chain Executive at Nordstrom, joined the company, she immediately recognized the need for clear spend visibility to drive strategic change. Implementing spend analytics provided the foundation for procurement transformation:
- Challenge: Fragmented data prevented comprehensive spend visibility across Nordstrom's complex retail operations
- Solution: Suplari consolidated spend data, enabling the team to "slice and dice in various ways" and reveal previously hidden insights
- Outcome: Procurement elevated from a tactical function to a strategic partner, building trust through "factual, repeatable, succinct, and meaningful information"
"Suplari gave us the tools to truly understand our spend—who the suppliers are, what we're spending with them, and who within the company is engaging with them," Karoline explains. "This visibility allowed us to craft strategies for improvements and unlock value within a long-standing organization."
The platform's consistent, reliable data became the foundation for more strategic supplier relationships and cross-functional collaboration, driving measurable procurement improvements throughout the enterprise.
BT Sourced
For Diarmuid O'Donoghue, Head of Digital Procurement at BT Sourced (British Telecom's procurement branch), the goal wasn't just gathering data but transforming it into actionable insights that drive meaningful change:
- Challenge: Disparate systems and manual processes left category managers dependent on Excel with limited visibility into strategic opportunities
- Solution: Implementing Suplari's intuitive platform provided actionable insights accessible in "essentially two clicks," enabling quick identification of high-growth suppliers and compliance issues
- Outcome: Transformed procurement from reporting function to strategic advisor through data-driven decision-making
"We didn't want just a general spend platform that relayed spend information back to us," Diarmuid notes. "We wanted something different that would help us unlock the true value of procurement away from general cost savings."
By making the platform accessible across finance, sales, and accounting, BT Sourced freed its procurement team to focus on strategic initiatives while empowering stakeholders with self-service analytics. This approach transformed how the entire organization views procurement's contribution.
MediaNews Group
Jeff Ball, Head of Procurement at MediaNews Group (one of the nation's largest newspaper publishers), found in Suplari the perfect tool to support the company's zero-based budgeting approach:
- Challenge: Complex organizational structure with properties like Chicago Tribune and New York Daily News required granular spend visibility for effective cost management
- Solution: Suplari's intuitive analytics provided comprehensive spend baseline with easy-to-use visualizations and sourcing opportunity identification
- Outcome: Enabled data-driven budget discussions and revealed significant price discrepancies across business units
"All of this comes from having the data at your disposal, at your fingertips, to be able to say, 'Why is this cluster of titles or business units paying 5X, 10X more for the same product and service that these clusters of titles are paying for?'" Jeff explains. "You can't do that without Suplari."
The platform's ability to identify spending trends, facilitate cross-departmental collaboration, and support decision-making proved invaluable for zero-based budgeting initiatives, transforming procurement from a back-office function into a strategic driver of cost savings.
These case studies demonstrate how effective spend analysis delivers value far beyond simple reporting—creating transparency, enabling better decisions, and transforming procurement into a strategic business function that drives measurable financial impact.
Future of spend cube analysis
As procurement continues to evolve from a tactical function into a strategic business partner, the ability to transform raw spend data into actionable intelligence has become a critical competitive advantage. Modern spend analysis goes far beyond simple reporting to deliver insights that drive measurable business impact.
Intelligence-driven procurement
The progression from spreadsheet-based analysis to AI-powered spend analytics represents more than just technological advancement—it reflects a fundamental shift in how organizations view procurement's strategic value. Today's most successful procurement functions are those that can rapidly analyze complex spend patterns, identify hidden opportunities, and act decisively based on data-driven insights.
This evolution is clearly demonstrated in the case studies we've examined, where organizations like Nordstrom, BT Sourced, and MediaNews Group have leveraged advanced spend analysis to transform procurement from cost centers into strategic value creators. Their success stories share a common thread: the ability to make spend data accessible, actionable, and aligned with broader business objectives.
AI Agents in Procurement
Perhaps the most transformative development on the horizon is the emergence of AI agents in procurement. These intelligent systems go beyond passive analytics to become active participants in procurement processes—identifying opportunities, initiating actions, and operating with increasing autonomy.
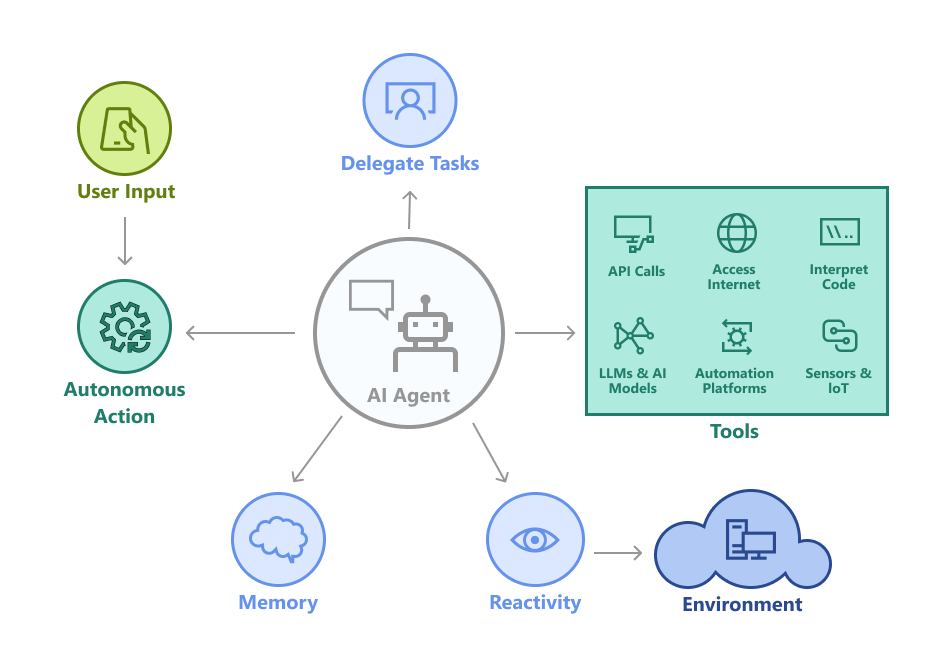
AI agents represent the next evolutionary step in procurement technology, moving from tools that require human operation to digital colleagues that can:
- Continuously monitor spend patterns and automatically flag savings opportunities
- Proactively identify compliance risks before they impact the business
- Initiate and manage routine negotiations with suppliers based on market conditions
- Automatically classify new vendors and recommend appropriate sourcing strategies
- Generate and distribute procurement insights tailored to specific stakeholders
As these capabilities mature, procurement teams will shift from manually analyzing spend to supervising AI agents that can independently identify, evaluate, and even implement cost-saving opportunities. This will dramatically accelerate procurement's impact while enabling human professionals to focus on strategic relationship management and complex sourcing decisions that require uniquely human judgment.
Bottom line on spend cube analysis solutions
Spend analysis solutions have been a core driver of procurement excellence for decades. The future of spend analysis promises even greater integration of agentic AI, and predictive capabilities. Forward-thinking procurement organizations are already moving beyond traditional analysis to incorporate real-time market intelligence, supplier risk monitoring, and automated opportunity identification.
The most successful procurement leaders will be those who can harness these capabilities not merely to report on what happened, but to shape what will happen—transforming spend data into a strategic asset that drives competitive advantage, operational resilience, and sustainable cost optimization.
Whether you're just beginning your spend analysis journey or looking to enhance an existing capability, the path forward is clear: invest in the right combination of people, processes, and technology that enables your organization to turn spend data into procurement excellence. The result will be a procurement function recognized not just for savings delivered, but for strategic value created across the enterprise.
About Suplari
Suplari is a procurement intelligence solution that helps businesses modernize procurement operations using AI. Suplari provides actionable intelligence to manage suppliers, deliver savings and manage compliance beyond the limits of traditional spend analytics. Suplari’s unique AI data management foundation empowers enterprise businesses to transform procurement operating models with reliable, AI-ready data.
