




Business intelligence platforms like Power BI, Tableau and Looker visualise data you have already modelled. Spend analytics platforms model procurement data first — resolving suppliers, classifying spend, enriching with external context and then present it. The distinction matters because most procurement teams discover it after they have already built the dashboard.
Power BI is genuinely capable and most enterprises already own it. The question is not whether it can display spend data. It can. The question is what has to happen before the data reaches it, and who does that work every month.
A note on where this perspective comes from
Suplari was acquired by Microsoft in 2021, specifically to bring AI to Dynamics 365, and spun back out as an independent company in 2024. That gave the team an unusually direct view of where the Microsoft data stack ends and where procurement-specific intelligence begins — and a genuine respect for what Power BI does well.
So this is not an argument that Power BI is the wrong tool. It is an argument about which layer of the problem it solves.
What Power BI does well for procurement
Let's start with the honest case for BI, because it is stronger than most vendor comparisons admit.
You already own it. Power BI is bundled into Microsoft E5 agreements at most enterprises. The marginal licence cost of a spend dashboard is often zero, which is a real advantage no procurement software business case can match.
The modelling engine is excellent. A properly built star schema in Power BI handles hundreds of millions of rows — well past the point where Excel stops entirely at 1,048,576 rows. VertiPaq compression on a columnar model is genuinely good at this shape of data.
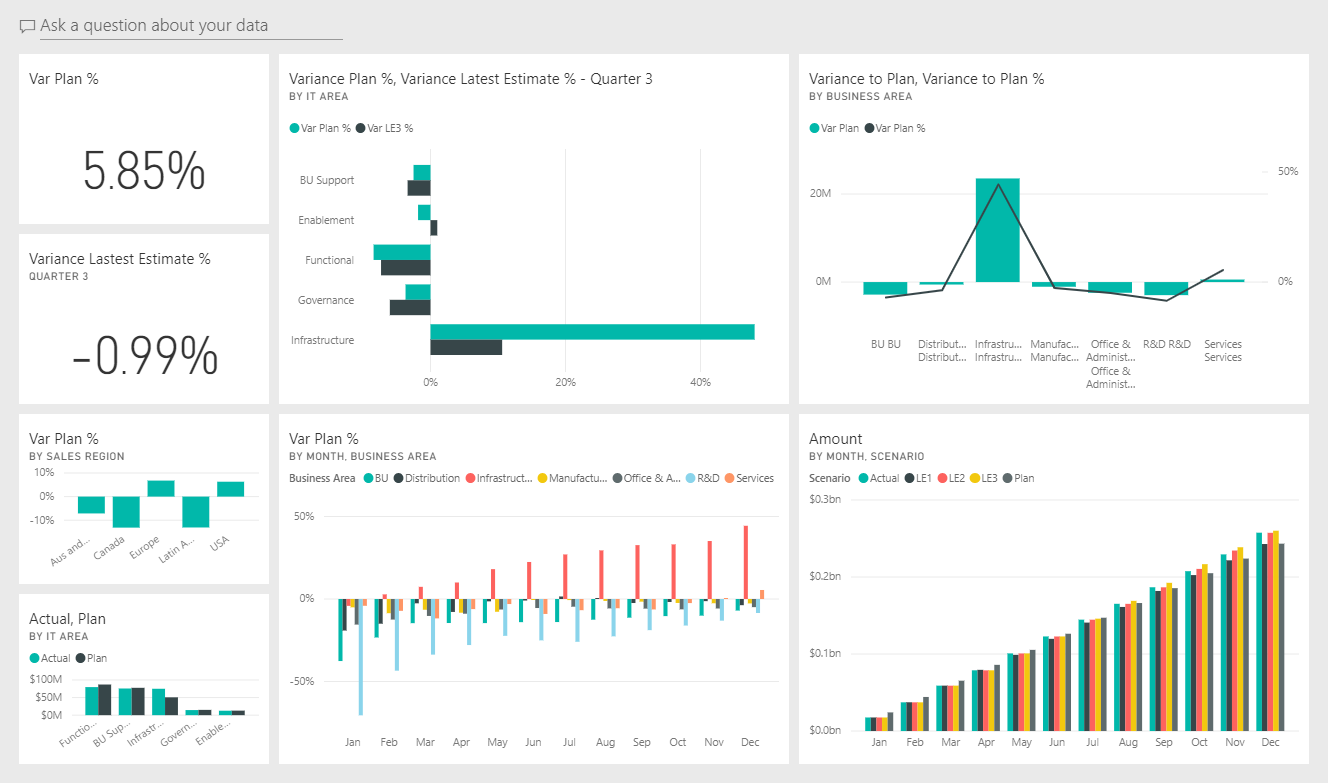
Microsoft ships procurement templates. The Dynamics 365 purchase content pack, and the Power BI procurement, corporate spend and IT spend samples, give you a working structure to start from rather than a blank canvas.
Distribution is solved. Row-level security, workspace permissions, mobile apps, Teams embedding and scheduled email subscriptions are all mature. Getting a number in front of forty stakeholders with the right access controls is a problem Power BI has already solved, and most procurement platforms have not solved as thoroughly.
Your data team already knows it. If IT has a Power BI centre of excellence, you inherit skills, standards and support.
None of that is faint praise. If your requirement is "show me spend by category by month, filtered by business unit, refreshed nightly", Power BI is a good answer and you should build it.
How I would build spend analytics in Power BI
For the practical case, here is the shape of the work.
1. Data preparation
Extract purchase order, invoice and AP transaction lines. Use Power Query to remove duplicates, standardise date and currency formats, trim and case-normalise text fields, and split any concatenated fields. This is the same preparation work as a spend analysis in Excel, at greater volume and with better tooling.
2. Build the star schema — the "spend cube"
A star schema is one central fact table surrounded by dimension tables. For procurement:
Relationships run one-to-many from each dimension to the fact table, single direction. Avoid bi-directional filters unless you can articulate exactly why — they are the most common cause of a model that produces subtly wrong totals.
This is the "spend cube" in modern form: the same three-dimensional view of who bought, what, and from whom that procurement has used for twenty years, expressed as a semantic model.
3. Write the core DAX measures
Total Spend = SUM(FactSpend[Amount])
Spend YTD = TOTALYTD([Total Spend], DimDate[Date])
Spend PY = CALCULATE([Total Spend], SAMEPERIODLASTYEAR(DimDate[Date]))
Spend YoY % = DIVIDE([Total Spend] - [Spend PY], [Spend PY])
Supplier Count = DISTINCTCOUNT(FactSpend[SupplierKey])
Non-PO Spend % =
DIVIDE(
CALCULATE([Total Spend], FILTER(FactSpend, ISBLANK(FactSpend[PONumber]))),
[Total Spend]
)
That last measure is worth building first. Non-PO spend is the share of purchasing that never passed through a purchase order — usually the fastest route to finding tail spend and maverick spend, and a number most procurement teams cannot produce on demand.
4. Build the visuals
Four that earn their place:
- Spend overview — total spend, monthly trend line, category column chart
- Supplier Pareto — spend descending with a cumulative percentage line, showing concentration
- Budget variance — actual against plan by category, with conditional formatting on the gap
- Supplier detail — drill-through page filtered to a single supplier
Add slicers for date, business unit and category. Set up an on-premises data gateway if any source is not cloud-hosted, and configure incremental refresh so you are not reloading history nightly.
That is a real spend analytics capability, and for many organisations it is enough.
The four things Power BI cannot do
Here is where the honest limits sit. None of these are criticisms of Power BI — they are simply outside what a BI tool is.
1. It cannot resolve your suppliers
"Acme Inc", "ACME INCORPORATED" and "Acme Logistics Ltd" arrive from three systems. Power BI will faithfully show them as three suppliers, because that is what your data says.
Power Query has a Fuzzy Merge with a similarity threshold, and it helps at small scale. It does not resolve parent-subsidiary relationships, it has no reference data about corporate structures, and — the part that catches teams out — its results shift as source data changes, so your supplier count moves between refreshes without anyone changing anything.
Entity resolution across systems that disagree is a data problem with a domain answer, not a visualisation problem. More on cleaning messy procurement data →
2. It cannot classify your spend
Power BI has no procurement taxonomy. DimCategory is a table you populate. Whether that happens through GL mapping, supplier-level assignment or keyword rules, you write those rules and you maintain them — and rules-based classification plateaus under 80% accuracy against real description fields, against 90%+ for AI classification that reads context and improves from corrections.
The dashboard inherits that accuracy silently. A beautifully built Power BI report on 74%-accurate classification looks exactly as convincing as one built on clean data, which is precisely the risk.
3. It cannot enrich with external context
Supplier financial health, risk ratings, ESG scores, commodity indices, parent-child hierarchies, diversity status — none of it is in your ERP. Power BI will happily display it once you have acquired, licensed, matched and maintained those feeds. Each of those verbs is a project. How internal spend and external intelligence combine →
4. It cannot close the loop
Power BI shows you that one category has 34 suppliers. It does not tell you that consolidating them is worth $180K, assign it to a category manager, track whether the negotiation happened, or confirm that the new rate reached the invoice.
That gap between identified and realized savings is where procurement most often loses CFO credibility, and no BI tool addresses it — not because Microsoft overlooked it, but because it is a workflow problem in a reporting tool. Proving what your team actually delivered →
The costs that do not appear in the business case
Suplari's CEO Jeff Gerber has written about the build-versus-buy decision in spend analytics, and the first assumption he identifies is the one that applies directly here: "we just need to pull the data into a data lake and put a BI tool on it."
Pulling data into one place is the easy part. Connecting it is the hard part — a procurement-specific schema, supplier harmonisation, parent-child relationships, normalised categories, master data resolution across systems that disagree. None of that arrives with Power BI.
Three costs follow from that, and none appear in a licence comparison.
Someone owns this now, permanently. The first version ships and works for about three months. Then a category manager wants a new view. Then an executive wants a different cut. Then a source system changes and the refresh breaks. Then the analyst who wrote the DAX moves teams. Internal reporting assets become orphans quietly, and the failure mode is not a crash — it is a dashboard nobody quite trusts that stays in use anyway.
The skill dependency is narrow and real. Power Query, star schema design and DAX are specialist skills. The person who has them in a procurement team is usually one person. Time-intelligence DAX in particular is easy to write and easy to write subtly wrong — an incorrect date table relationship produces year-on-year numbers that look plausible and are not.
Licensing scales differently than expected. Power BI Pro caps semantic models at 1 GB, which enterprise spend data can exceed once you hold several years of line-level detail with dimensions. Moving to Premium Per User or Fabric capacity changes the economics, and capacity planning becomes a conversation with IT rather than a procurement decision.
The decision framework
Rather than a feature comparison, three questions that settle it.
What outcome are you actually trying to deliver? If the goal is a recurring spend report for the CFO with cuts by category and business unit, Power BI is a good answer and probably the cheapest one. If the goal is a continuous view that finds opportunities you did not know to look for and proves the savings landed, you are describing a different category of product. The objective tells you the answer, not the tooling comparison.
Is your spend data already trustworthy? This is the question that decides it. Power BI is a presentation and modelling layer, not a data quality layer — it will visualise badly classified spend as faithfully as clean spend, and more persuasively than a spreadsheet would. If suppliers are unresolved and categories unreliable, a BI project makes the problem look solved without solving it.
Who owns it in three years? If you cannot name the person responsible for the semantic model, the refresh, the DAX and the feature requests three years from now, you are building an asset with a known expiry date.
When Power BI is genuinely the right call
- Your spend sits in one ERP with reasonably consistent supplier master data
- You need reporting and distribution more than opportunity discovery
- You have a BI team with capacity, not just a BI licence
- Your requirement is stable — the same questions each period
- The organisation is small enough that context lives in people's heads
Jeff Gerber makes this point directly: for small companies where complexity is genuinely low — where you can walk across the hall and ask the person who placed the PO — a disciplined internal build often beats a six-figure software contract. That is a real answer, not a consolation.
When a dedicated platform is the right call
- Spend spans multiple ERPs, AP systems and expense tools
- Supplier master data disagrees between systems
- You need external context — risk, ESG, market pricing — not just internal reporting
- You are measured on realized savings, not reported spend
- Your team's scarce resource is analyst time
The hybrid most enterprises should actually run
The build-or-buy framing is misleading, and so is Power-BI-or-platform. The teams getting this right treat it as a stack decision.
If you have a data lake and a Power BI practice, those are assets, not obstacles. A procurement intelligence platform can read from the lake and write classified, enriched spend back out — at which point Power BI becomes the distribution layer it is genuinely excellent at being, sitting on data that is finally trustworthy.
The order matters, and most teams try it backwards. Building the dashboard first and hoping data quality follows is the pattern that produces a report nobody trusts. Resolving and classifying the data first, then distributing it through the BI tooling the organisation already knows, is the same investment sequenced correctly.
What is genuinely not worth doing is the maximal version of build: the data pipeline, plus the domain model, plus the classification engine, plus the enrichment feeds, plus the opportunity detection, plus the savings workflow. That is not a BI project. As Gerber puts it, that is becoming a procurement software company — and you are a procurement function.
Why the dashboard was never the point
There is a deeper issue underneath the tooling question, and it applies equally to Power BI, Tableau and every spend dashboard ever demoed.
A dashboard sits there. Somebody opens it. Their eyes scan. If they notice an anomaly, they investigate; if they do not, it persists. Most material things that go wrong in procurement happen quietly — payment terms drifting, a category fragmenting, a supplier merging with a competitor — and none of them announce themselves with a flashing tile.
Even when someone spots it, they need context to judge whether it matters, and time to act. Procurement teams are typically short of both. Industry research consistently finds only a minority of identified opportunities are ever worked on.
The dashboard era assumed the human was the engine that cleared the bottleneck. The human is the bottleneck. Charts and graphs are not enough anymore — which is why the meaningful comparison in 2026 is not between two ways of drawing a chart, but between a system that displays spend and one that watches it.
How Suplari fits
Suplari is a procurement intelligence platform, not a BI tool, and it is designed to sit alongside your Microsoft estate rather than replace it.
An AI-ready data foundation unifies and classifies spend across every source system without replatforming — built for imperfect data from day one, so it does not require a data project first. Procurement-specific AI agents then monitor that classified spend continuously and surface named opportunities, with 175+ prebuilt insights generated automatically. Closed-loop tracking connects each action through to realized savings the CFO can audit.
Value typically within 90 days. Suplari is the highest-rated spend analysis solution on Gartner Peer Insights, scored top marks in Spend Matters SolutionMap (2025), and was selected for the ProcureTech100 (2025/26). Customers include BT Group, Nordstrom and MediaNews Group.
If you are weighing options, it is worth reading our breakdown of the leading spend analysis platforms before taking any vendor meeting — including ours.
Bottom line
Power BI is a good tool doing exactly the job it was built for. The mistake is not choosing it — the mistake is expecting a visualisation layer to solve a data quality and domain problem, then concluding that spend analytics does not work when the dashboard turns out to be untrustworthy.
Decide what has to be true underneath the chart. If your spend data is already resolved and classified, build the Power BI report and move on. If it is not, no amount of DAX will fix it, and the dashboard will simply make the problem harder to see.
See what classified spend looks like before it reaches your dashboard →

